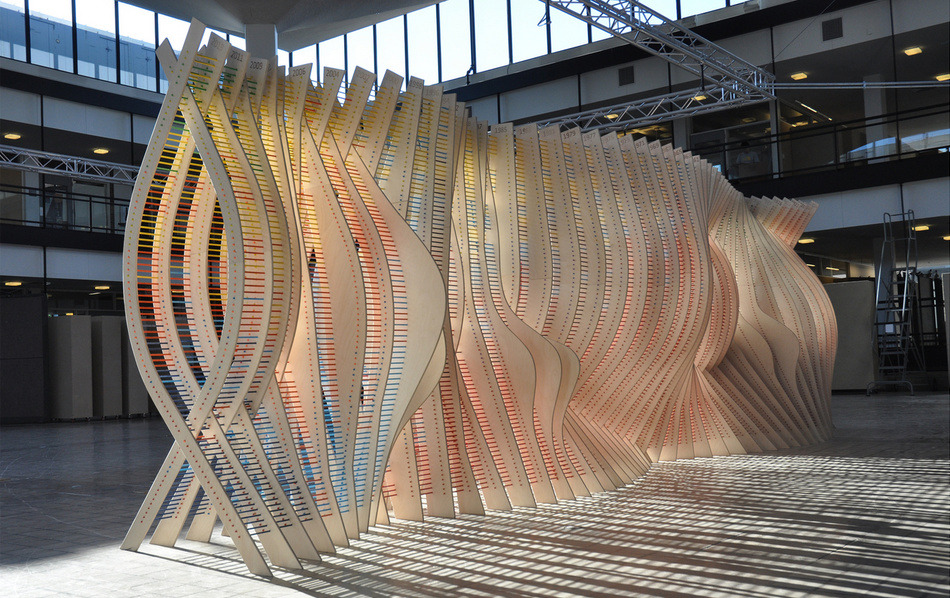
"Centennial Chromagraph" by Adam Marcus and Daniel Raznick of Variable Projects
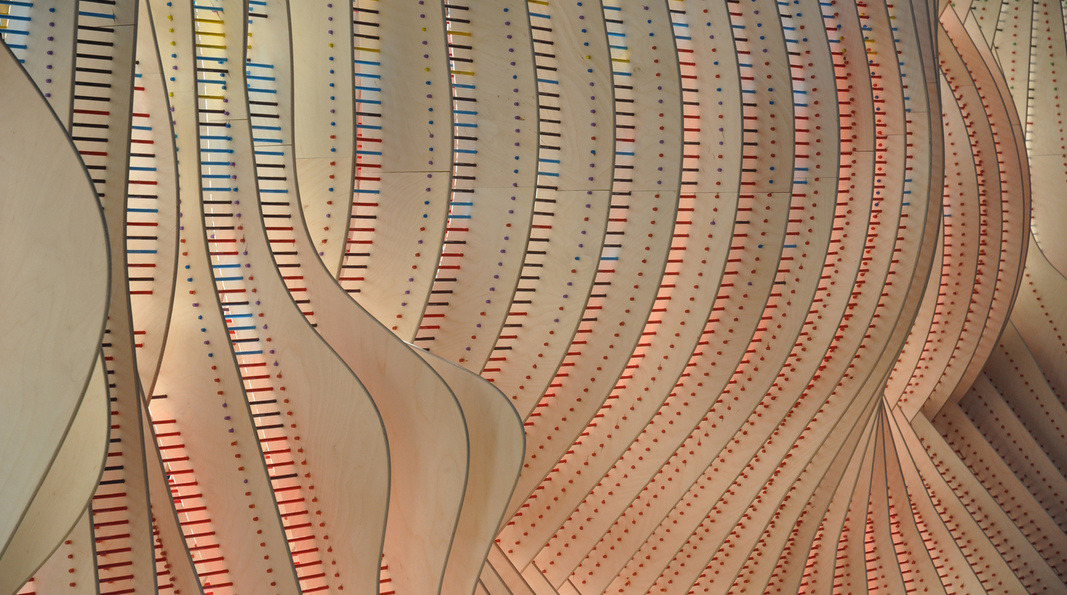
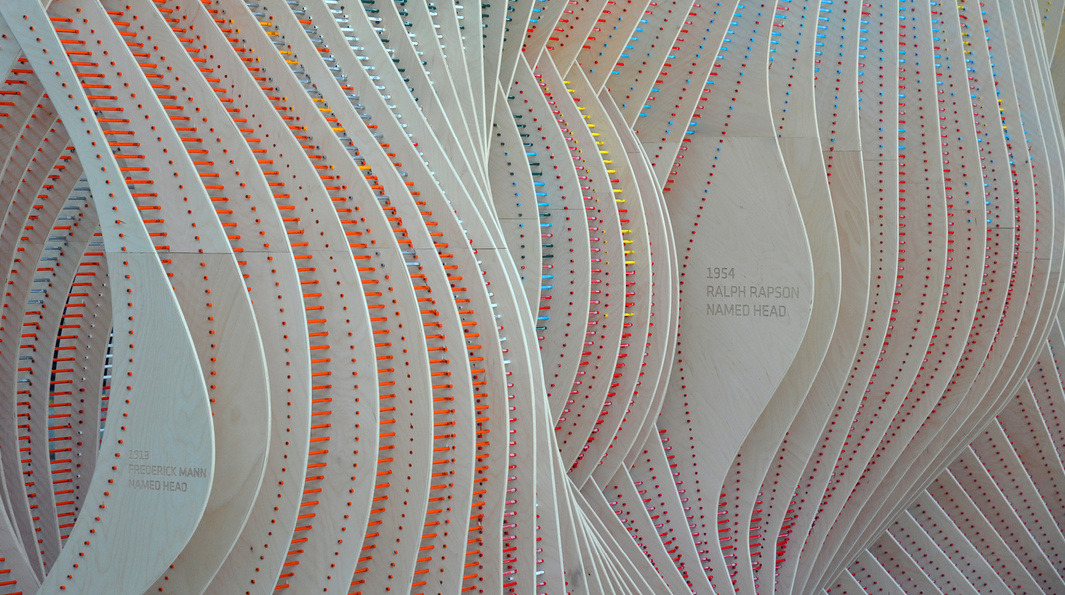
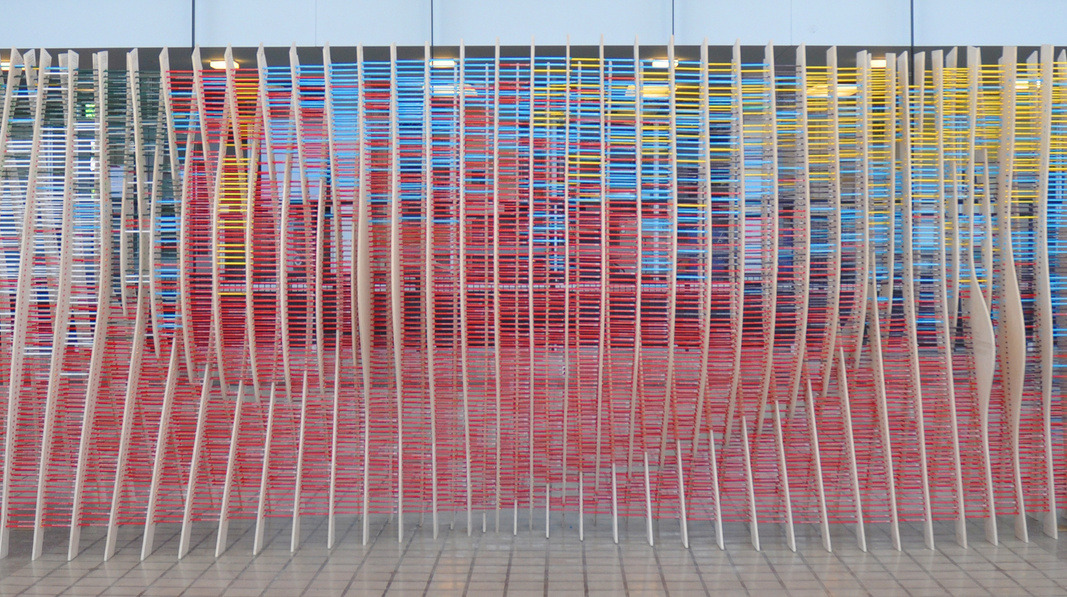
This sculpture composed of 8,080 colored pencils and plywood represents a three-dimensional timeline of the history of the University of Minnesota School of Architecture over the course of the past century. The pencils' colors represent the school's degree programs, making this basically a very beautifully conceived bar graph, but it's
"The first phase of the project was a data mining and data analysis exercise, in which we explored a series of mapping studies based on the School’s alumni database. The Rhinoceros 3d modeling software package and its Grasshopper parametric modeling plugin were used to visualize the data in three dimensions, in relation to class sizes, degree types, and geographic locations of the School's graduates through time."
No comments:
Post a Comment